s.id Logo

Link analytics

See which links work.Then improve the rest.

Review clicks, estimated unique visitors, and QR activity over time. Paid plans add referrer, approximate country, device, and browser insights; Growth and Scale add CSV export.

Analytics dashboard in s.id showing link clicks over time
  • Start free
  • No credit card
  • Analytics depth and history depend on your plan

What is Link Analytics?

Link analytics measures activity around shortened links and dynamic QR codes. It helps you compare clicks, estimated unique visitors, QR activity, and changes over time so you can see which links are earning attention.

s.id keeps the reporting depth plan-aware: core activity is available on Free, paid plans add referrer, approximate country, device, and browser context, and Growth or Scale adds CSV export. Link analytics measures engagement—not downstream conversions or customer identity.

Start with the signal, then add the context.

Use core activity to spot a pattern, then bring in the plan-dependent detail that helps explain it.

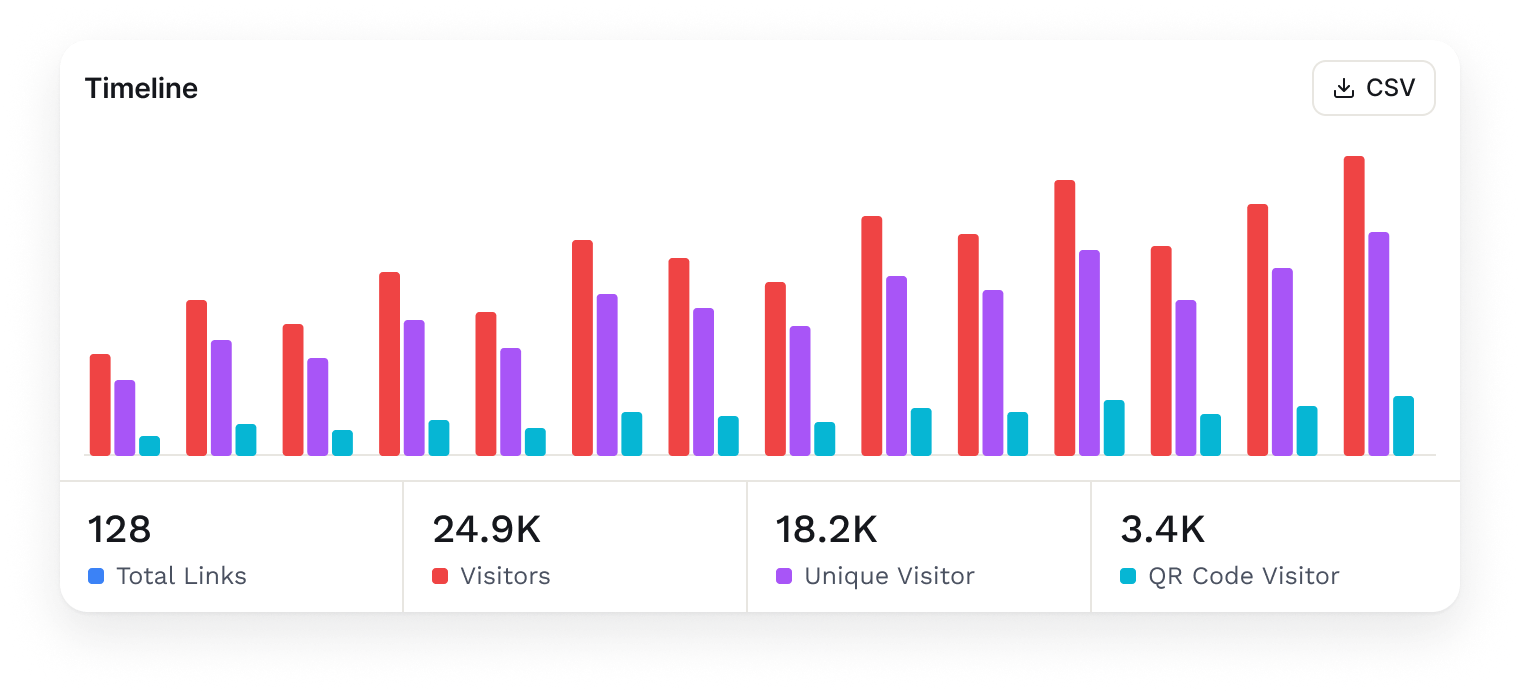
Timeline chart of link clicks, visitors, and QR activity

Spot the change over time

Read click, visitor, and QR activity in clear charts designed to make changes over time easier to spot.

24.9K

Visitors

18.2K

Unique Visitor

Reach, not just clicks

Paid plans show estimated unique visitors across the retained history available to that plan.

timeline.csvGrowth and Scale
datetime,visitor,unique_visitor,qr_code_visitor
2026-03-01 00:00,412,318,64
2026-03-02 00:00,538,402,71
2026-03-03 00:00,486,361,58

Take the data with you

Growth and Scale plans can export analytics as CSV for deeper analysis and reporting workflows.
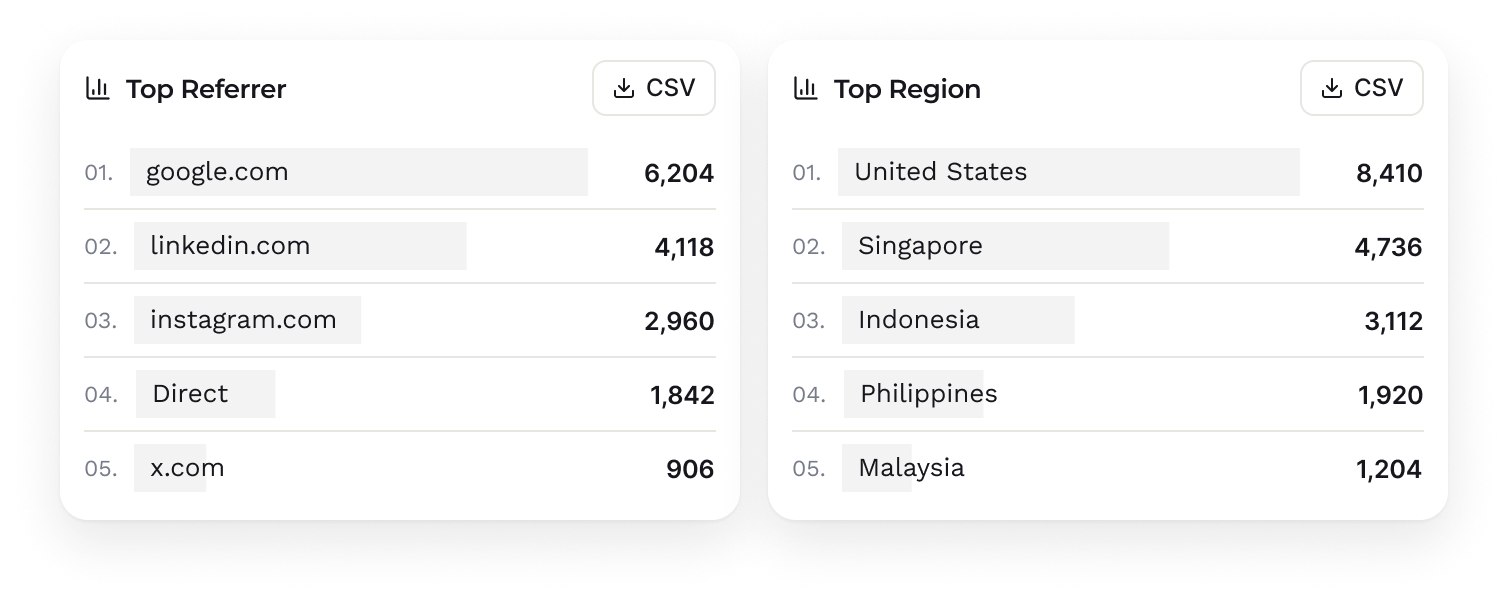
Lists of top referrers and regions for a link

Find out what sent them

Paid plans add referrer, approximate country, device, and browser breakdowns to explain click activity.

Date range

Free7 days
Launch, Growth, Scale60 days

Choose the window

Choose from the date range available to your plan: 7 days on Free and up to 60 days on paid plans.

Data retention

Free30 days
Launch, Growth180 days
Scale365 days

Keep the history

Review up to 30, 180, or 365 days of retained analytics, depending on your plan.

Analytics access by plan.

See exactly which reporting depth, history, and export options are included before you choose a plan.

Per month, billed annually
Total Unique Visitors
Advanced Analytics
Analytics Date Range
Analytics Data Retention
Export to CSV

Free

$0

No time limit

Total Unique Visitors—
Advanced Analytics—
Analytics Date Range7 days
Analytics Data Retention30 days
Export to CSV—

Solo

$5.00

$59.99 a year

Total Unique VisitorsYes
Advanced AnalyticsYes
Analytics Date Range30 days
Analytics Data Retention90 days
Export to CSV—

Launch

$10

$120 a year

Total Unique VisitorsYes
Advanced AnalyticsYes
Analytics Date Range60 days
Analytics Data Retention180 days
Export to CSV—

Growth

Most Popular

$24.17

$290 a year

Total Unique VisitorsYes
Advanced AnalyticsYes
Analytics Date Range60 days
Analytics Data Retention180 days
Export to CSVYes

Scale

$82.50

$990 a year

Total Unique VisitorsYes
Advanced AnalyticsYes
Analytics Date Range60 days
Analytics Data Retention365 days
Export to CSVYes

Prices are shown in USD. If your payment method uses another currency, your provider may apply its own conversion rate and fees.

Questions we get a lot.

Still stuck? Talk to the team at helpdesk@s.id.

What data does s.id analytics track?
Core analytics covers total clicks, estimated unique visitors, QR activity, and trends over time. Paid plans add referrer, approximate country, device, and browser breakdowns. Growth and Scale plans also include CSV export.
How long is analytics data retained?
The Free plan keeps 30 days of analytics. Launch and Growth keep 180 days, while Scale keeps 365 days. The selectable date range is 7 days on Free and up to 60 days on paid plans.
Can I export analytics data?
CSV export is included with Growth and Scale. You can use the file in a spreadsheet or your existing reporting workflow; Free and Launch do not include CSV export.
Does s.id support UTM parameter tracking?
You can add UTM parameters when building a destination URL, then use those tags in a downstream analytics platform that reads them. The s.id dashboard reports link activity; it does not provide a dedicated UTM attribution report.
Is s.id analytics available for QR codes too?
Dynamic QR codes can report QR activity. The same plan rules apply: paid plans add approximate country, device, browser, and referrer context, while available history depends on the plan.
How is s.id analytics different from Google Analytics?
s.id analytics focuses on activity around short links and dynamic QR codes without requiring code on the destination site. A web analytics platform can measure on-site behavior and conversions when it is installed on a site you control; the two tools answer different questions.

Turn every shared link into a learning loop.

Start free. No credit card. Analytics depth and history depend on your plan.